Open-source product analytics.
Pug records what happens in your product — page views, clicks, scrolls, custom events — and ties every event to a person.
Ask questions with trends, funnels, retention, and user flows.
Self-host the whole stack, or use the free cloud.
- app_close 4d ago
- scroll 4d ago 72%
- page_view 4d ago
- app_open 4d ago
- checkout_started 4d ago USD 416.21
- add_to_cart 4d ago prod-0198
- search 4d ago shirt
First events in two minutes.
Initialize the SDK and auto-tracking starts immediately — no event plan, no instrumentation sprint. Call identify() when someone signs in; their anonymous history merges into their profile.
import { init, identify, track } from '@pug-sh/browser'

init('your-project-id', { apiKey: 'pub_your_key' })

// Page views, clicks, scrolls, form interactions, rage clicks,
// and dead clicks are captured automatically from here on.
identify('user_123', { email: '[email protected]', plan: 'pro' })
track('signup', { plan: 'pro' })
track('order_completed', { amount: 49.0, currency: 'USD' })
import 'package:pug_flutter/pug_flutter.dart';
await Pug.init('your-project-id', const PugOptions(apiKey: 'pub_your_key'));
// Auto-tracking starts immediately. Identify users on sign-in:
await Pug.identify('user_123', traits: {'plan': 'pro'});
// Typed methods for well-known events (custom props go in extras):
Pug.track.signup(extras: {'plan': 'pro'});import { Pug } from '@pug-sh/node'
const pug = new Pug({ apiKey: process.env.PUG_API_KEY }) // private key, prv_…
// Server events name the user explicitly — no ambient session.
pug.track('user_123', 'order_completed', { amount: 49.0, currency: 'USD' })
await pug.identify('user_123', { email: '[email protected]', plan: 'pro' })
// Private keys can also read: profiles and insight queries.
const profile = await pug.profiles.getByExternalId('user_123')- page_view every route change
- click element, text, selector
- scroll max depth per page
- form_submit form interactions
- rage_click frustration signal
- dead_click clicks that did nothing
- signup name any action you care about
- order_completed with properties — amount, currency
- video_play queryable like any built-in event
- Geo (country, region, city)
- Device & browser
- UTM parameters
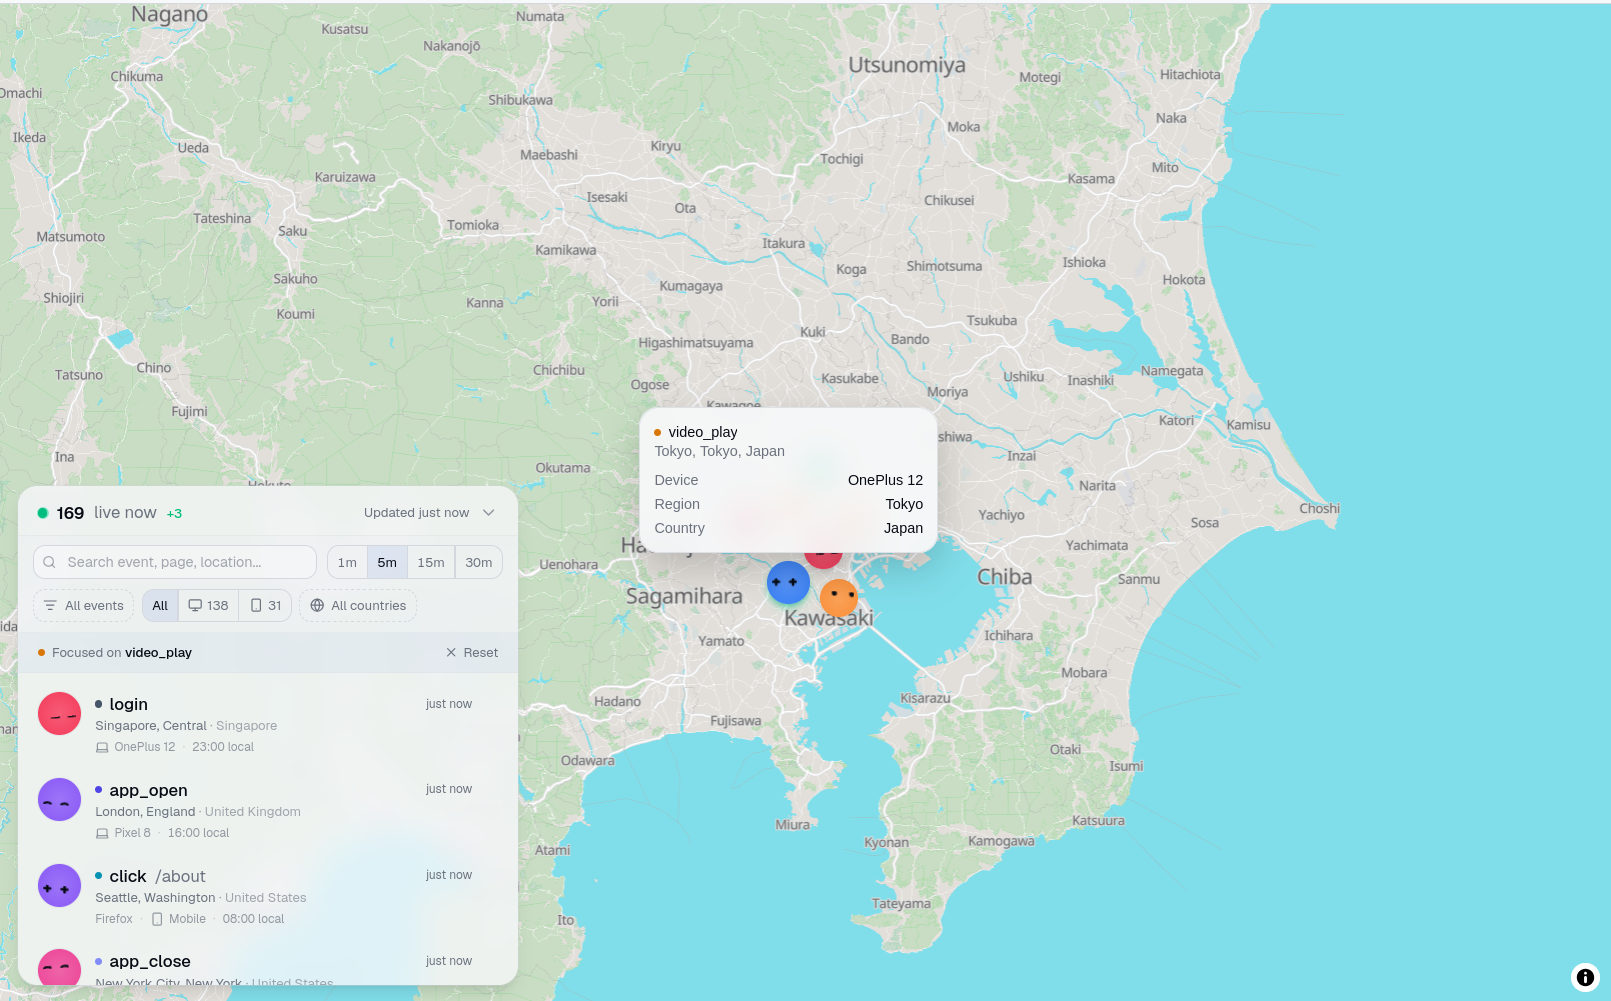
See events arrive in real time.
Every event shows up seconds after it happens — on a live map and in a stream, with the page, device, and location already attached.
- Ship a tracking change and know within seconds that it fires
- Watch a launch land as it happens: how many people, from where, on which pages
- Filter to the event behind a new feature and watch the first real users hit it
One profile per person, not per device or session.
The profile you saw at the top of this page is the core of Pug: every session, trait, and event a person ever generated, in one searchable timeline.
- Before sign-in, events accrue to an anonymous ID
- identify(userId) merges that history into one profile
- Works across devices: web today, app tomorrow — same person
- Traits (plan, email, anything) live on the profile and filter every insight
- page_view anon
- scroll anon
- add_to_cart anon
-
identify('user_123')history joins - signup
- order_completed
Six ways to turn events into answers.
Every insight runs over raw events in ClickHouse — filter by any property, break down by any dimension, and get answers in seconds.
Trends
Time-series of any event. Count, unique users, avg per user, or sum/avg/min/max of a numeric property. Break down by up to 5 properties.
Funnels
Conversion across ordered steps, with drop-off and average time between steps.
Retention
Cohort heatmap from a start event and a return event — who comes back, and when.
Segmentation
One aggregate sliced by any dimension — built for KPI tiles and scorecards.
User flow
A Sankey of the paths users actually take between events — where they go next, where they drop.
Top K
Ranked values of any property — top pages, top referrers, top products — with an “others” bucket.
The numbers you check every morning, on one board.
Pin any insight as a tile. The whole board shares one time window, so every tile answers the same question: how is this period doing against the last one?
- KPI, line, area, bar, table, and Sankey tiles
- One time window and granularity for the whole board
- Period-over-period comparison per tile
- Thresholds that color a KPI when it crosses a limit
- Markdown tiles for notes between charts
- /pricing 4,812
- /docs/quickstart 3,080
- /changelog 1,781
Run it on your servers, or use ours.
The entire pipeline is open source — the same code serves the cloud and your own deployment.
Self-hosted
- One Go binary runs the server and every worker
- PostgreSQL for accounts and config, ClickHouse for events, NATS for the queue
- AGPL-3.0 — read the code, run it anywhere, your data never leaves
Cloud
- Managed hosting with zero ops
- Open beta — free
- Pricing announced before general availability
Customer engagement, from the same profiles.
Run campaigns on the people you already track — composed from profiles and events, delivered to the channels your users are on.
See the roadmap- Web Push
- SMS
- Android Push
- iOS Push
- Webhook
Start tracking today. Own your data forever.
Open source, self-hostable, and free during open beta. Create a project and see live events in minutes.
Questions? Email [email protected]